INTRODUCTION
The causality between economic growth, financial deepening and financial inclusion has been well recognized in India’s development strategy, particularly since the reforms of the early 1990s. However, an accelerated effort through targeted interventions has been a more recent story. Access to finance, especially by the poor and vulnerable groups is a prerequisite for employment, economic growth, poverty reduction and social cohesion. The banking industry in India has recognized this imperative and has undergone certain fundamental changes over the last two decades. Reforms since the early nineties in the banking sector have facilitated increasing competition, the development of new generation private sector banks as well as technological breakthrough in diverse financial products, services, and delivery channels. With the recent developments in technology, both delivery channels and access to financial services have transformed banking from the traditional brick-and-mortar infrastructure like staffed branches to a system supplemented by other channels like automated teller machines (ATM), credit / debit cards, internet banking, online money transfer, etc.
GET HELP INSTANTLY
Place your order to get best assignment help
(since 2006)
The financial services include the entire gamut – savings, loans, insurance, credit, payments etc. The financial system must provide its function of transferring resources from surplus to deficit units but both deficit and surplus units are those with low incomes, poor background etc (Anand and Chhikara, 2013) There are certain factors that lead to financial exclusion such as low income, financial illiteracy, lack of proper documentation, distant financial institution and complex financial goods and services.
Different economists and organizations define financial inclusion in different ways. But all give the same meanings like access to financial goods and services at reasonable price for all members of society especially poor group by formal financial institutions.
Financial inclusion, thus, has become an issue of worldwide concern, relevant equally in economies of the underdeveloped, developing and developed nations. Building an inclusive financial sector has gained growing global recognition bringing to the fore the need for development strategies that touch all lives, instead of a select few. Through inclusive financial system poor people get benefits by using broad range of financial services at low price
Economic growth has important policy implication for the welfare of the society. Growth is the single important factor affecting the income of the poor. Therefore, economic growth is the key to understand how to increase the income of the poor to bring them out of poverty. Financial institutions finance those entrepreneurs which introduce innovative and new goods in the market and results in economic growth.
The relationship between both of them have been studied in detail by use of different variables.
WHAT IS FINANCIAL INCLUSION?
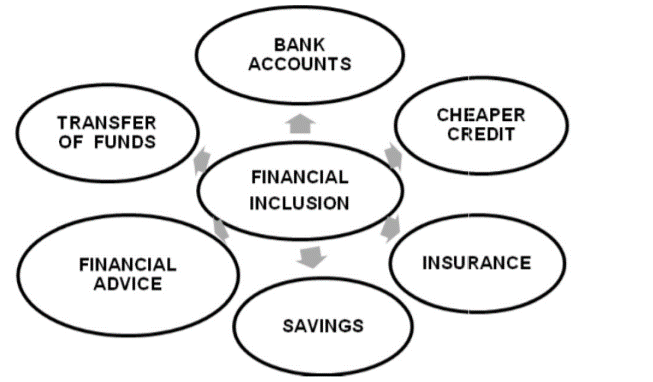
The concept of financial inclusion is the method of offering banking and financial services to the individuals who are part of the society without any discrimination. The same is to provide for inclusion every individual by providing them with the basic financial services without looking to the total income or the savings of the individual. This is mainly meant for the people who are not able to avail financial services because of the less income or the weaker sections of the society.
The aim is also to provide equal treatment to all people living in the society. The use of the financial services should be judiciously used by all participants of the country. It is very well-known fact for availing any financial credit, many types of documents are required. But in this inclusion, the aim is to provide services to the people who are not able to avail any kind of credit only because of non-availability of proper documentation (Kumarand and Acharya, 2021) Different banks have their different polices to grant loans and due to which the underprivileged ones to not able to get access to such facilities.
The aim of financial inclusion is to eliminate such type of barriers and provide economically priced financial services to the less fortunate sections of the society. This is to done to make the underprivileged people of the society financially independent so they can curb the viscous circle of charity or means of getting funds which are not sustainable.
Another aim is to spread awareness of financial services and financial management among the people of the society. It wants to develop formal and systematic credit avenues for the poor people (Le and Taghizadeh-Hesary, 2019)
Poor people are inclined towards the unformal or unorganised forms of credit which are provided them on higher interest rates as they are given the proper documentation. There are many schemes which are launched by the government of India to promote financial inclusion.
The same can be summarised in the form of diagram which is represented as under:
GOVERNMENT SCHEMES TO PROMOTE FINANCIAL INCLUSION IN INDIA
The government of India and its central bank i.e., Reserve Bank of India have been constantly working on the schemes to promote financial inclusion in India. Some of the schemes and its advantages are listed as under:
- Pradhan Mantri Jan Dhan Yojana
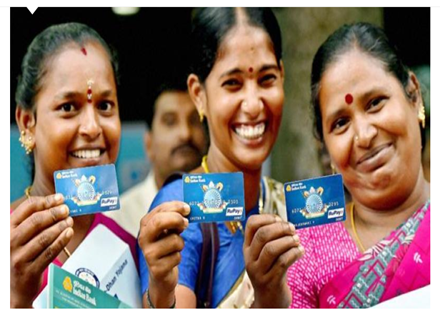
This was announced on the Independence Day as a national mission to include comprehensive financial inclusion of all the households in the country. The main highlights of the scheme that having a saving account in bank is not necessary without any requirement of minimum balance in such account. This helps the persons who have no knowledge about the banking services can get access to the financial products through the financial literacy programmes. In addition to this, they receive debit cards, insurance cover of amount of upto Rs 2 lakhs and access to overdraft facility. The overdraft facility can be availed on the basis of six months history of credit worthiness. This is one of the bold, innovative and ambitious schemes launched by the government. This can be seen through the fact that 28.70 crores which covers 68% of the total population have opened their accounts.
- Atal Pension Yojana
This scheme was launched in the year 2015. The scheme is open to all and available for people in the age category of 18-40 years. The subscribers to this pension scheme receive a guaranteed pre-decided monthly pension starting from the range of Rs 1000-Rs 5000 at the age of 60 years. If the main subscriber is no more, then the benefit passes on to spouse and then the children of the family. This is also in the case of pre-mature death of the subscriber. As per the latest data, 321.05 lakh subscribers have been enrolled for this scheme.
- Stand Up India Scheme
This scheme was launched in the year 2016. The scheme facilitated the loans amounting to Rs 10 lakhs to Rs 1 Crore to at least one schedule caste or schedule tribe member. This also included providing loan to one women borrower so as to set up the greenfield enterprises. The enterprise was to be associated with the allied activities of the agriculture either in the nature of manufacturing or trading in nature. The scheme was launched in order to provide benefit to 2.5 lakhs of borrowers initially which is operational through the scheduled banks of the country.
This is not only providing the loans but also promoting entrepreneurship among women of SC or ST category. The people of these category majorly face the problems in availing loans due to lack of knowledge or mentorship. The applications are made through the dedicated online portal established by the government and amount of Rs 26,688 crores has been disbursed in 1,18,462 accounts.
In order to expand the credit and financial services to more and more sections of the population, a wide network of financial institutions has been established over the years. The government has been introducing more strengthened and rigorous system to improvise the system of financial inclusion. The organized financial system comprising commercial banks, regional rural banks (RRBs), urban co-operative banks (UCBs), primary agricultural credit societies (PACS) and post offices are being made to the needs of financial services of the people. Besides, MFIs, self-help groups (SHGs) also meet the financial service requirements of the poorer segments. Furthermore, development of the institutional framework in recent years has focused on new models of expanding financial services involving credit dispensation using multiple channels such as civil society organizations (CSOs), nongovernment organizations (NGOs), post offices, farmers’ clubs, and panchayats as business facilitators/correspondents. Specific financial instruments/products were also developed in order to promote financial inclusion.
It can be seen from the above schemes that the government is constantly making efforts for promoting the financial inclusion in India.
PATTERN OF FINANCIAL INCLUSION IN INDIA
The section is based on the Inclusix reports by CRISIL. It is one of the first attempt made by it to include states to report the status of financial inclusion in India. It is the first inclusion index for providing financial services and information which are beyond the basic concept of banking. It measures the level of financial inclusion using the level for Branch Penetration, Credit Penetration, Deposit Penetration and Insurance Penetration. The levels can be determined by way of below table which is as under:
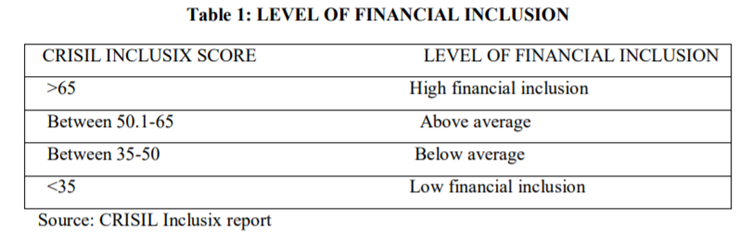
The first figure in the said table indicates the progress of financial inclusion in the whole country. The data is in rising trend which indicates that there has been wide increase in the levels of all different types of penetration. The index has started in the year 2013 and it is showing that there is high increase in the upcoming years.
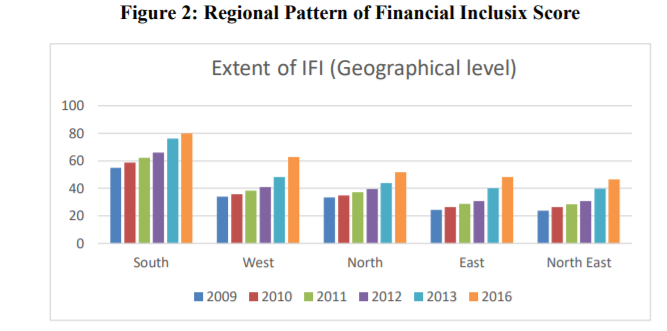
Reserve Bank of India has also introduced new bank accounts and other banking facilities in order to promote the concept of financial inclusion. It is pertinent to note that PMJDY is one of the first schemes launched by the government of India to register in Guinness Book of World Records. The increase in the index in the past years can be witnesses through the below graph:
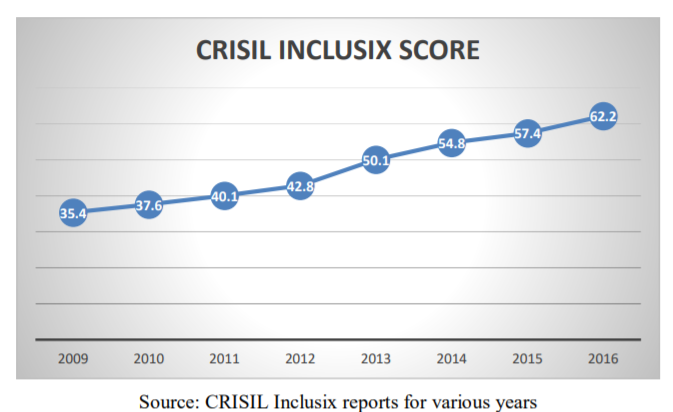
This figure again shows how there has been increasing trend in the past years and how some of the regions are majorly contributing to this concept. Also, it has to be noticed that there is high number of literacies in the southern part of India in which one of the cities being Kerala has the highest score of 90.9. on the other hand, the northern regions being the least active (Sachs and Ramiah, 2002) This is because of less knowledge, lack of financial literacy and awareness among such people.
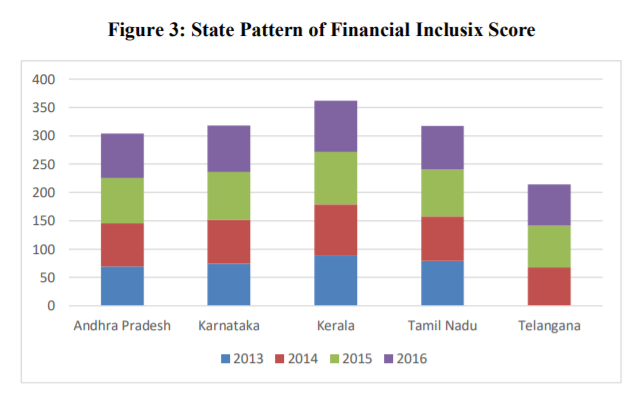
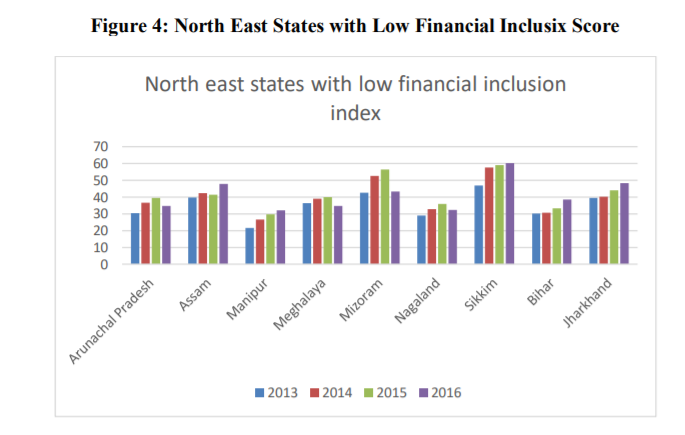
The below stated figures depict the states with the highest level of financial inclusion in India. It can be seen that the southern region has been the highest contributor whereas the northern being the least (Iqbal and Sami, 2017). The main reason of the same could be the high amount of literacy in south and low amount of literacy in the north. This is also indicative of high credit penetration which could possibly mean that there is more awareness of credit facilities in these sectors. In addition to this, the concept of micro-financing has also been playing a key role in serving the poor and low sections of the society who are not well aware of such facilities. They not only provide the financial help to such people but are also providing the financial information which can help them to be independent and gain more of financial knowledge.
Also, there is increase in number of bank accounts opened under the scheme PMJDY which is as under:
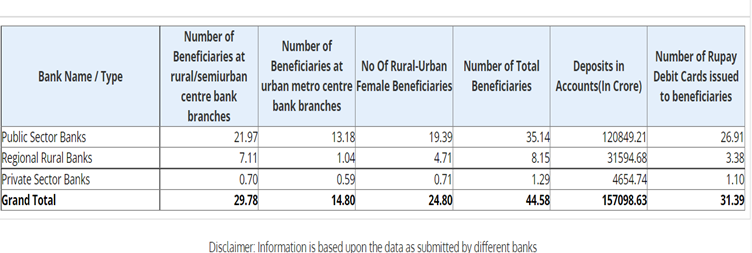
From the above table it can be seen that there is increase in opening of accounts which makes it evident that there is increase in concept of financial inclusion and people are getting more aware of the financial information.
MATHEMATICS AND DATA TO SUPPORT THE FINANCIAL INCLUSION
All of the data is not the primary data but is derived from various sources which makes it clear that there is huge increase in the concept of financial growth. The ratios, percentages and all the other relevant data are derived from various government sites (Schuetz and Venkatesh, 2020) The gaps in the data are filled using the mathematical model using the moving average forecasting technique.
At the first step, the test of demand and supply hypothesis is done, for which data of 12 stated have been used. The data can be extracted from official website of RBI and CRISIL.
Another approach which is the panel approach which helps in making the performances on the basis of measurement and the issues related to the limited degrees of the freedom are being approached. In the said framework, the relationship between the CRISIL Inclusix score and the measure of the per capita income is derived which can be as under:
Log(IFIit) = α +β1Log(PCIit) + εit Approach under Model 1
Log(PCIit) = α +β1Log(IFIit) + εit Approach under Model 2
In the above formula, i= 1,2….; t=1,2,…. And εit is the form of disturbance
The theory used above is not clear and hence the theory between PCI and IFI is applied to determine the possible direction of the said relationship. Also, it has been assumed that Wald Statistics are independently and identically distributed among the different individuals. This can be viewed with the help of statistic Z bar when there are two variables, T and N which can be assumed to be infinity and also rule of normal distribution is followed. Z-bar is used to follow the rule of normal distribution (Singh and Kumar, 2014) All the variables are tested using the theory of null hypothesis and is ultimately based on Z-bar and Z-tilde. If the said variables are greater than the standard critical values then one should reject H0 and it can be concluded that the concept of Granger causality exists.
For the larger data sets, instead of the T and N variables Z-bar should be used and in the cases of smaller data sets, Z-tilde should be considered. Also there are other models, one of them being the Monte Carlo simulations which have shown effective results using the finite sample properties using both T and N variables.
Moreover, it is important that the correct model for the approach is being chosen as the results can affect the testing to a greater extent. This can be either in the form of fixed effect or random effect models (Schuetz and Venkatesh, 2020) The fixed effect models are used for analysing the specific state factors which is not in the case of random effect models.
In the first and instant case, for selection of any model, test of Hausman specification should be used. The said test follows the concept of Chi-square distribution following the variables of k for freedom. K is said to be the variable measuring the number of slope parameters which are existent in the said model. If the value is greater than 0.05, then it can be said that such test should be rejected and the same is co-related with the explanatory variables and hence it could be concluded that instead of random effect models, the test of fixed effect models should be used (Sethi and Acharya, 2018) This can be one of the best choices for using the panel estimations and the results could be more conclusive.
The below mentioned graph is presented for study and understanding the relationship between the financial inclusion and economic growth:
| Test Statistics | H0: logpci does not Granger-cause logifi. H1: logpci does Granger-cause logifi for at least one panel var (state). | H0: logifi does not Granger-cause logpci. H1: logifi does Granger-cause logpci for at least one panel var (state). |
| W-bar | 3.3380 | 2.5473 |
| Z-bar | 5.9607 (0.00) | 3.9449 (0.00) |
| Z-bar tilde | 1.2783 (0.2011) | 0.6736 (0.500) |
This is one of the tests which is being done to examine the main reason of causality using the Granger non- causality test. This is also evident of the relationship between the supply and demand hypothesis of financial inclusion and economic growth.
After the selection of the standard panel method for determining the model, the final and the last step would be analysing whether the fixed method or the random effect method should be used (Guz and Rushchitsky, 2009)
In the first method, specific effects of the country are assumed to be correlated with the explanatory variables whereas in the second method, the specific effects of the country are not assumed to be corelated. For examining the validity of the method of both the methods, the test of Hausman Specification is to be applied. This is done as it implies that selection of the concerned method has been validated. The below results indicate that null hypothesis has been rejected in the first model which makes it evident that the fixed effect method is more reliable than the random effect method. The said study is not suitable for the method 2
Hausman Specification
| Model 1: Dependent Variable-IFI | ||
| Null Hypothesis | Chi2(1) = (b-B)'[(V_b-V_B)^(-1)](b-B) | Probability |
| Ho: difference in coefficients not systematic | 11.05 | 0.0009 |
| Model 2: Dependent Variable-PCI | ||
| Null Hypothesis | Chi2(1) = (b-B)'[(V_b-V_B)^(-1)](b-B) | |
| Ho: difference in coefficients not systematic | 0.36 | 0.55 |
The panel data regression has been used to examine the results of the said hypothesis. The below indicated table is reflecting the study of the results using both the methods (Grohmann and Menkhoff,2018) In the first model, it is showing that there is increase in per capita income which is giving a positive effect upon the financial inclusion. The percentage of one percent increase has been there in per capita income which is causing increase of 1.12% in IFI. This is reflecting the relationship between the demand and supply which is financial inclusion and the economic growth.
Results of Panel Regression: Variables used-IFI
| Independent Variable Fixed Effect Random Effect | Independent Variable Fixed Effect Random Effect | Independent Variable Fixed Effect Random Effect |
| Log(PCI) | 1.22 (13.19) | 1.12 (12.81) |
| Constant | -3.98 (-9.39) | -3.51 (-8.74) |
| R-sq: within | 0.6589 | 0.65 |
| R-sq: between | 0.41 | 0.41 |
| R-sq: overall | 0.43 | 0.43 |
| N | 104 | 104 |
| F-Statistics | 173.88 | 164 |
| Prob > F | 0.000 | 0.000 |
The below table presents the results arrived using both the methods. But in the case of model-2, random effect method is used which is concluded by Hausmen specification test (Gul and Majeed, 2018) The results in the below table indicate that there is increase in financial inclusion which is increasing the per capita income and giving a positive effect on both the results. The increase percentage is one percent in IFI which is causing increase of 0.53 percent in per capita income. Again the results are reflecting the relationship between the demand and supply which is financial inclusion and the economic growth.
Results of Panel Regression: Variables used-PCI
| Independent Variable Fixed Effect Random Effect | Independent Variable Fixed Effect Random Effect | Independent Variable Fixed Effect Random Effect |
| Log(IFI) | 0.53 (13.19) | 0.54 (13.51) |
| Constant | 3.70 (56) | 3.70 (46) |
| R-sq: within | 0.65 | 0.65 |
| R-sq: between | 0.41 | 0.41 |
| R-sq: overall | 0.43 | 0.43 |
| N | 104 | 104 |
| F-Statistics | 173.88 | 164 |
| Prob > F | 0.000 | 0.000 |
Hence, the results clearly state that there is strong relationship between the financial inclusion and economic growth.
STUDY USING THE STRUCTURAL EQUATION APPROACH
The approach used to achieve the study using this method has been very systematic. In order to know about the different items which, contribute to the financial inclusion and to eliminate the factors which are not contributing to the concept of financial inclusion. The questionnaire has been formed with the set of thirty-seven questions which have been identified as critical variables which will help in determining the impact of financial inclusion in the economic development (Garg and Agarwal, 2014) At the first step, to determine the answers to the said questions, the pilot survey was carried out which resulted in elimination of many questions at the first step. Some were deleted as the same was causing duplication in some of the data items. Not only items were deleted but also some items were added which were based mainly on the recommendation of the people. As a result of these steps, final questionnaire of twenty-nine questions has been formed. The data has been restricted to some parts of the country and the banks which have been selected are State Bank of India, Gramin Bank (Chhattisgarh) and Apex Bank. The total of 285 questionnaire has been received, out of which 240 have been used for the further analysis. Using the said data, a hypothesis has been made which is as under:
H1: Access to the primary banking services to the individuals
H2: Availability of the banking
H3: Usage of the banking services
H4: Direct Impact on Economic Development
RESULTS USING HYPOTHESIS TESTING
Results of Hypothesis Testing
| Hypothesis | Hypothesized path / Structural relationship | Standardized Estimates | P-value | Is hypothesis Supported? |
| H1: Access to the primary banking services to the individuals | AV <— FI | .643 | .000 | Supported |
| H2: Availability of the banking | AC <— FI | .488 | .000 | Supported |
| H3: Usage of the banking services | US <— FI | .853 | .000 | Supported |
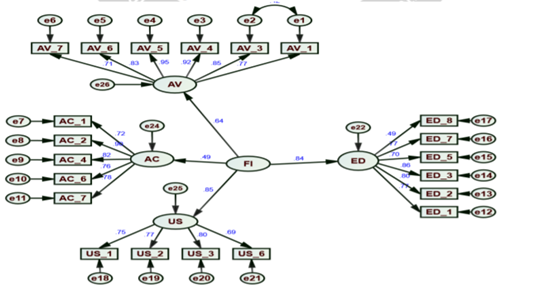
| H4: Direct Impact on Economic Development | ED <— FI | 844 | .000 | Supported |
It becomes evident from the SEM results (Figure 1 & Table 9) that Availability (ß = .643, p = .000), Access (ß = .488, p = .000) and Usage (ß = .853, p = .000) significantly predicts financial inclusion. Thus, hypotheses H1, H2 and H3 stands accepted. Moreover, SEM results indicate that financial inclusion has positive significant and direct impact on economic development (ß = .844, p = .000). Therefore, hypotheses H4 are also accepted
A) USE OF THE DATA AND ITS RESULTS
The data arrived from the questionnaire using the statistical package (SPSS v23) for Cronbach’s alpha, factor analysis. SEM being one of the data packages which is available on the SPSS platform was used to finish the first step of factor analysis and to determine the inter-relationship among the different factors and the same have been further used for the testing of the conceptual model.
- PROFILE OF THE RESPONDENTS
The below mentioned table indicates the demographic profile of the respondents. The population were firstly divided on the basis of gender which are 58% of the total population are males whereas the remaining ones are females being 42% of the total population. The second basis is age of the respondents and which are below the age of 29 years comprises 37% of the total population (Chauvet and Jacolin,2017) The age group of 30-39 years old comprises 24% of the total population. It is clear that the age group of middle age are contributing majorly to the total population. These are the people who are actively involved in using the banking services and are availing the major benefit of the schemes introduced by the government.
If we see the analysis, bank wise, it can be seen that out of the total 250 respondents, State Bank of India are holding 46%, the second one being Apex Bank holding 31% and the remaining 23% is with the Gramin Bank (Chhattisgarh). Thus, the study reveals that SBI is the major contributor to the banking services of the country.
| Profile of The Respondents | |||
| Variables | Categories | Frequency | Percentage |
| Gender | Male | 145 | 58% |
| Female | 105 | 42% | |
| Age | Upto 29 | 92 | 37% |
| 30-39 | 60 | 24% | |
| Above 50 | 45 | 18% | |
| Bank | SBI | 115 | 46% |
| Apex Bank | 77.5 | 31% | |
| CRGB | 57.5 | 23% | |
| Education | Primary School | 35 | 14% |
| Secondary School | 60 | 24% | |
| Bachelor Degree | 112.5 | 45% | |
| Master Degree Or Above | 42.5 | 17% | |
| Income | Upto Rs 9,000 | 115 | 46% |
| Rs 10,000-19,000 | 82.5 | 33% | |
| Rs 20,000-29,000 | 37.5 | 15% | |
| Rs 20,000 And Above | 15 | 6% |
If the from the above table, most respondents were well educated as to the range of 62% which are holding the Bachelor Degree. It is very much clear that the financial inclusion is different among the people belonging to the different background (Balakrishnan and Parameswaran, 2007) Thus, out of the major three districts, it can be seen that only one of them is majorly contributing to the concept of financial inclusion.
- EXPLANATION OF THE DIFFERENT FACTORS
a)AVAILABILITY OF BANKING SERVICES
The first and foremost part of the services is that the banking services should be easily available to all the customers. Moreover, the banks not provide the basic services of the bank but also provide the other services like insurance, other various schemes which are attractive like cashbacks. Some of them are listed as under:
- Banks are also providing the services of insurance
- Various schemes are available for opening the saving account in any of the bank
- Debit Card facilities and other services are also made available to the customers
- Approach towards the customers is very friendly
It can be seen that the employees of the banks are contributing for making the people understand that how opening bank account and usage of the related services are very necessary for the overall growth of the bank and overall as the total economy.
b) ACCESS OF BANKING SERVICES
The statements which have been identified using the data of the respondents are:
- Opening of Bank Accounts are easy
- Bank are located at convenient locations
- Banking Services or the related institutions are easily available
- Employees of the bank are cooperating with the customers
- Relevant information is easily accessible
- After the above analysis, it can be observed that the customers are much happy with the banking services which are available to them and are very helpful (NWAFOR, 2018) This is increasing the basic concept of banking services in the area and people are majorly contributing to the same
c) ECONOMIC DEVELOPMENT
The major components which have identified that the concept of financial inclusion is in alignment with that of economic growth is as under:
- Increase of the life expectancy of the members of the family
- Increased access to the basic education among the society
- Provided the major usage of financial inclusion so that each member can realise his/her own capability
- Increase in the per capita income of the family
Hence, looking to the overall effects of the inclusion of financial services, it can be seen that how this concept is increasing the normal life of the members of the society (Bagli and Dutta, 2012.) This is not improving them as separate individuals but also their contribution to the whole country is also increasing.
d) USAGE OF BANKING SERVICE
The factors which have been observed under this category are as under:
- Using the services of the bank to deposit the money
- Regular visiting bank for understanding the different kind of services available
- Money saving is much easy
- Interest Income on the idle money kept in the bank account which is greater than keeping the same at home
Hence, it can be seen that how the use of the bank services is increasing the well-being of the individuals (Singh and Kumar, 2014) The people are realising that how these banking services can of so use to them and how the same can contribute towards the increase in the economy.
STRUCTURAL EQUATION MODEL
This model is an effective technique for conceptualizing a theoretical model and also for validating the relationships among the different variables (Patel and Patel, 2021) This also defines the nature and strength of identified relationships. In this study, it will be useful for the below reasons:
- confirmatory factor analysis to support the constructs established through exploratory factor analysis
- testing the structural model by testing the hypotheses using path significance analysis for every construct of the research model for each path
- VALIDITY AND RELIABILITY OF THE CONSTRUCTS OF THE MEASUREMENT MODEL
The results of the different relationships among the variables and constructs are majorly represented by the data to assess the factors which include fitness, validity and reliability of the financial inclusion. The three main dimensions are access, availability and usage of the banking services. Construct validity was established in this study by establishing the face validity, factor loading, Cronbach’s alpha, convergent validity and discriminate validity. For analysing the reliability, factors composite reliability (CR) and average variance extracted (AVE) are being used. These factors should posses the value which is greater than 0.7 and AVE should be greater than the value of 0.5.
Results of Panel Regression: Variables used-PCI
| CR | AVE | MSV | MaxR(H) | ED | AC | US | AV | |
| ED | 0.870 | 0.634 | 0.011 | 0.938 | 0.796 | |||
| AC | 0.896 | 0.695 | 0.320 | 0.977 | 0.485 | 0.834 | ||
| US | 0.836 | 0.716 | 0.391 | 0.983 | 0.358 | 0.566 | 0.846 | |
| AV | 0.938 | 0.706 | 0.391 | 0.987 | 0.446 | 0.357 | 0.625 | 0.840 |
It can be seen from the above table; the different variables have significant impact on the factor AVE. the AVE for each of the factor is greater than 0.5 and CR is greater than 0.70 which is in support of convergent validity of the constructs. The difference among the validity is analysed with the corresponding inter-construct squared correlation estimates (Williams and Dare, 2017) Thus, the measurement model has an adequate validity and construct’s reliability.
- ASSESSING MODEL FIT OF MEASUREMENT MODEL
The initial model indicated the inadequate parameters with the data which can be improved only with the modifications. The value should be greater than the 0.9 and RMSEA should be less than 0.08. The values defined are (CMIN/DF = 9.963, GFI = .874, TLI = .827, NFI =.849, CFI = .862, RMSEA = .134) in which relevant modifications are required. The same are to be based on the modification index. After incorporating these modifications to the model, the modified model demonstrated a better model fit and is used as the final model for hypothesis testing (CMIN/DF= 1.672, GFI = .935, NFI = .918, TLI = .925, CFI =.965, RMSEA = .052)
GOODNESS-OF-FIT (GOF) OF THE INITIAL SEM
| GOF Measures | Final SEM | Recommended Levels | Evaluation |
| 2 /degrees of freedom (CMIN/DF 2/df | 1.672 | 1–2 | Acceptable |
| Root mean square error of approximation (RMSEA | .052 | <0.1 | Acceptable |
| Goodness-of-fit index (GFI) | 0.935 | >0.9 | Acceptable |
| Comparative fit Index (CFI) | 0.965 | >0.9 | Acceptable |
| Normal fit Index (NFI ) | 0.918 | >0.7 | Acceptable |
| Tucker-Lewis Index (TLI) | 0.925 | >0.9 | Acceptable |
The said model is to be accepted as all of the values are greater than 0.9 and RMSEA is greater than 0.08. All of the above value are in the range which should be accepted. This model indicates that there is reasonable fit of the measurement model with data gathered. In short, the CFA of SEM model confirms to the four-factor structure containing 21 measured variables, which contributes significantly to respective constructs all the 21 items loaded significantly (p< 0.001) on the relevant latent constructs or factors. The final refined SEM with standardized coefficients and standard regression weights are shown presents the standardized regression weights and covariance estimates for the final SEM with the corresponding standard effort of estimates and p-values (Sarma and Pais, 2011) The final model using SEM will look as under:
ECONOMIC GROWTH
The basic definition of the economic growth can be defined as the increase in production of the goods and services from one period to the another. This can also be said to be an increase in aggregate production in an economy. In other words, increase in incomes, inspiring consumers to buy more, which means a higher material quality of life or standard of living. The rate of economic growth is the annual rate of growth in GDP between the first and the last year over a period of time. The said growth rate represents the trend in the average level of GDP over the period, and ignores any fluctuations in the GDP around this trend (Van, 2021) Due to financial inclusion, the poor and needy people get benefits from banks in the form of savings or credit. This increases the productive power of poor and talented entrepreneurs which generates employment in lower sector of economy. Ultimately the production of goods and services increases. Hence output increases that lead to rise in economic growth. The ability to produce the economic goods and services are as under:
- Increase in per capita income of workers:
An economy with more physical capital can produce more than an economy with less physical capital. This is because of the reason that savings and investment add to the stock of capital which increases the amount of capital and more of capital investment leads to increase in economic growth.
- Amount and labour quality:
The workers are required for any kind of work to be done by any industry or factory. If the number of workers do not increase in the economy, the level of the production will not increase and if the same does not increase, it will lead to decrease in the growth of the overall economy.
- Level of the technology advancement
If we look at the developed economies, they are growing because of the fact that they are use less of the human labour and more of the technology related services. This not only saves the time but also increases the capacity of doing the work more effectively and efficiently.
Thus, for developing any economy, the economic growth is much needed and every country has to keep developing the different ideas so that the same can be developed.
RELATIONSHIP BETWEEN ECONOMIC GROWTH AND FINANCIAL INCLUSION
The relation between economic growth and financial depth is identified by number of economists. It has been discovered that the average of three measures of growth was taken over the time and three measures are these (i) real per capita GDP growth (ii) real per capita capital stock growth (iii) total productivity growth. The main function of financial sector is to reallocate the funds of those people which have a large amount of capital to those people or firms which are deficient in funds. Finance may simply create investment opportunities, and thereby contribute in long run growth. The industries depending on finance provided outside the industry are larger in countries having developed financial sector. It is found that efficiency of investment has positive impact on output growth. There is no difference between finance-growth relationship of developing and industrialized countries. Both financial development and financial openness has positive affect on growth and are beneficial for it. There is a need of resources to attain the objective of inclusive growth. Financial inclusion plays important role in economic growth through generating and mobilizing the resources. Through formal financial system the inclusive finance for all units of economy affects economic activities. Financial development, such as easy access to loans and more credit facilities create more investment and productive opportunities that leads to growth. Banks should come forward to set up counselling centres and guide their clients about the features, benefits and risk of various financial products. These measures will help India in developing the banking services and providing the access to the total population of the India.
CONCLUSION
In the said report, the detailed relationship between financial inclusion and economic development is studied in detail. Thus, to summarise the concept it can be said that the financial inclusion is a long strategy aims at reaching all segments of people, especially to reach formal financial services to the underprivileged in an economy (Babajide and Omankhanlen, 2015) Access to safe, easy and affordable credit and other financial services by the poor and vulnerable groups, disadvantaged areas and lagging sectors is recognised as a pre-condition for accelerating growth and reducing income disparities and poverty. It has been well recognised that access to financial services facilitates making and receiving financial payments and reduces transaction costs. Furthermore, access to financial services contributes to higher production and social protection, as the financial sector – through stored savings, credit and insurance – serves as a measure of crisis mitigation.
Though the government has initiatives for the poor still the ultimate benefit is not availed by them fully. Government is in the right direction and takes sincere efforts through the organised Financial Inclusion policies. Thus, banks would have to evolve specific strategies to expand the outreach of their services in order to promote financial inclusion (Wellalage and Locke, 2021). Financial inclusion has positive and significant effect on economic growth.
Thus, looking to the study of economic growth and financial inclusion, it can be seen that the concepts have improved in increasing trend and the population is also keen to be more aware about the banking services and the financial management. The people are learning more and more so that they can contribute to the economy as a whole. By more connection with banking services means that savers and investors are getting more benefits from services provided by commercial banks that increase the level of financial inclusion which in turn leads to growth of country.
Therefore, in developing country like India, it is important that the people should be empowered as individuals and then contribute to the growing economy. This will help the country to be in better picture and achieve great heights when competed with the others.
REFERENCES:
- Anand, S. and Chhikara, K.S., 2013. A theoretical and quantitative analysis of financial inclusion and economic growth. Management and Labour Studies, 38(1-2), pp.103-133.
- Balakrishnan, P. and Parameswaran, M., 2007. Understanding economic growth in India: A prerequisite. Economic and Political Weekly, pp.2915-2922.
- Babajide, A.A., Adegboye, F.B. and Omankhanlen, A.E., 2015. Financial inclusion and economic growth in Nigeria. International Journal of economics and financial issues, 5(3), pp.629-637.
- Bagli, S. and Dutta, P., 2012. A study of Financial Inclusion in India. Radix International Journal of Economics & Business Management, 1(8), pp.1-18.
- Chauvet, L. and Jacolin, L., 2017. Financial inclusion, bank concentration, and firm performance. World Development, 97, pp.1-13.
- Garg, S. and Agarwal, P., 2014. Financial inclusion in India–a Review of initiatives and achievements. IOSR journal of business and Management, 16(6), pp.52-61.
- Grohmann, A., Klühs, T. and Menkhoff, L., 2018. Does financial literacy improve financial inclusion? Cross country evidence. World Development, 111, pp.84-96.
- Gul, F., Usman, M. and Majeed, M.T., 2018. Financial Inclusion and Economic growth: A global perspective. Journal of Business & Economics, 10(2), pp.133-152.
- Guz, A.N`. and Rushchitsky, J.J., 2009. Scopus: A system for the evaluation of scientific journals. International Applied Mechanics, 45(4), pp.351-362.
- Iqbal, B.A. and Sami, S., 2017. Role of banks in financial inclusion in India. Contaduría y administración, 62(2), pp.644-656.
- Kumar, V., Thrikawala, S. and Acharya, S., 2021. Financial inclusion and bank profitability: Evidence from a developed market. Global Finance Journal, p.100609.
- Le, T.H., Chuc, A.T. and Taghizadeh-Hesary, F., 2019. Financial inclusion and its impact on financial efficiency and sustainability: Empirical evidence from Asia. Borsa Istanbul Review, 19(4), pp.310-322.
- NWAFOR, M.C., 2018. The nexus between financial inclusion and economic growth: Evidence from Nigeria. International Journal of Science and Innovation in Social Science, 2(4).
- Patel, A.K., Singh, K., Singh, M. and Patel, A.K., 2021. Publication trends in Financial Inclusion: A Scientometric Assessment and Visualization. Library Philosophy and Practice (e-journal), 5115, pp.1-20.
- Sachs, J.D., Bajpai, N. and Ramiah, A., 2002. Understanding regional economic growth in India. Asian Economic Papers, 1(3), pp.32-62.
- Sahoo, P. and Dash, R.K., 2009. Infrastructure development and economic growth in India. Journal of the Asia Pacific economy, 14(4), pp.351-365.
- Sarma, M. and Pais, J., 2011. Financial inclusion and development. Journal of international development, 23(5), pp.613-628.
- Sethi, D. and Acharya, D., 2018. Financial inclusion and economic growth linkage: Some cross country evidence. Journal of Financial Economic Policy.
- Singh, C., Mittal, A., Garg, R., Goenka, A., Goud, R., Ram, K., Suresh, R., Chandrakar, R. and Kumar, U., 2014. Financial inclusion in India: Select issues. IIM Bangalore research paper, (474).
- Schuetz, S. and Venkatesh, V., 2020. Blockchain, adoption, and financial inclusion in India: Research opportunities. International journal of information management, 52, p.101936.
- Wellalage, N.H., Hunjra, A.I., Manita, R. and Locke, S.M., 2021. Information communication technology and financial inclusion of innovative entrepreneurs. Technological Forecasting and Social Change, 163, p.120416.
- Williams, H.T., Adegoke, A.J. and Dare, A., 2017. Role of financial inclusion in economic growth and poverty reduction in a developing economy. Internal Journal of Research in Economics and Social Sciences (IJRESS), 7(5), pp.265-271.
- Van, L.T.H., Vo, A.T., Nguyen, N.T. and Vo, D.H., 2021. Financial inclusion and economic growth: An international evidence. Emerging Markets Finance and Trade, 57(1), pp.239-263.