The methodology computes the cost of capital for the index by including each of the fifty companies of the Nifty index.
- 1.EXECUTIVE SUMMARY …………………………………………………………………………………2
- 2.Introduction: WACC (Weighted Average Cost of Capital) ………………………………………………………3
- 2.1 About the Paper ………………………………….4
- 2.2 Literature Overview ………………………………..5
- 3.Data Extraction and Methodology ………………………………….6
- 3.1 Estimation of Market Return ………………………………….6
- 3.2 Estimation of Risk Free Rate ………………………………..7
- 3.3 Estimation of Beta value: ………………………………….7
- 3.4 Estimation of Short Term Debt: ………………………………..8
- 3.5 Estimation of Long Term Debt: ………………………………….8
- 3.6 Estimation of Total Debt ………………………………..8
- 3.7 Estimation of Equity Portion of Companies: ………………………………….9
- 3.8 Market Capitalization: ………………………………..9
- 3.9 Estimation of Weight of Equity and Debt: ………………………………….9
- 3.10 Estimation of Cost of Equity ………………………………..10
- 3.11 Estimation of Cost of Debt ………………………………….11
- 3.12 Estimation of WACC of Individual Companies ………………………………..11
- 3.13 Estimation of WACC of an Index ………………………………….12
- 3.14 Estimation of Cost of Equity (CoE) of an Index Companies ………………………………..12
- 3.15 Estimation of Cost of Debt (CoD) of an Index ………………………………..13
- 4. Result and Analysis ……………………………………………………………………………………………………….14
- 5.Conclusion …………………………………………………………………………………16
1. EXECUTIVE SUMMARY
This report provides a calculation and analysis of the Weighted Average Cost of Capital (WACC) of the CNX Nifty 50, which is one of the two major stock indexes in India.
The methodology computes the cost of capital for the index by including each of the fifty companies of the Nifty index. An aggregate cost of capital is then calculated for all the companies, leading to a new benchmark called the cost of capital of the Nifty 50 stocks.
All calculations are shown in the appendices. The results of the calculation show that companies prefer Equity Financing to Debt. There has been a greater variation in the cost of debt during the period of study.
The report concludes that WACC alone cannot be used to predict the overall economy of a country. The WACC of an Index cannot be used as an ideal benchmark to calculate the WACC of a company as it depends on multiple factors.
There are two major limitations in the report. Firstly, it assumes that the list of 50 companies who are part of the CNX Nifty 50 have remained constant for the entire duration of the study. Secondly, while calculating beta, the average beta of the year does not capture the volatility due to major crises like the subprime crisis and the recession.
2. Introduction: WACC (Weighted Average Cost of Capital) SUMMARY
WACC is used to calculate the cost of capital of a firm. To calculate WACC, all the components of capital of that firm are weighted individually. Components such as common stock, preferred stock, bonds and any other long-term debt etc. are used in the calculation of WACC.
In the 1950s, two professors Modigliani and Miller (M&M) studied and researched capital structure. From their findings, they developed the “capital structure irrelevance proposition”. According to their hypothesis, it did not matter what capital structure a company uses to finance its operations in a perfect market.
They theorized that the market value of a firm is determined by the risk of its assets and the earning capacity of the firm. A firm’s value would be independent of how it chooses to distribute its dividends or choose to finance its investments.
M&M’s “capital structure irrelevance proposition theory” (Theory -1) assumes no taxes and no bankruptcy costs. With this in mind, WACC will remain constant with changes to company’s capital structure. Which in other words tells us, irrespective of how much debt a firm has; there will be no tax benefits from interest payments thus no benefit or changes to WACC. M&M theory-1 does not account for taxes, transaction costs, and bankruptcy costs, borrowing costs for investors and the firm and the effect of debt on earnings.
However, in the real world, there are taxes, transaction costs, bankruptcy costs, information asymmetry and debt. To account for this, M&M conceptualized tradeoff theory of leverage (Theory-2). This theory recognizes the tax benefits from interest payments, as interest paid on debt reduces taxes. Issuing bonds reduces the tax liability of a firm. M&M’s theory-2 deals with the WACC. It states that the proportion of debt in the firm’s capital increases and the return on equity also increases. M&M’s theory-2 states, corporate taxes acknowledges the corporate tax savings from the interest tax deduction and thus concludes that changes in the debt-equity ratio do affect WACC. Therefore, a greater proportion of debt lowers the company’s WACC.
The CNX Nifty 50 is the national stock exchange (NSE) benchmark for India’s equity market. It operates under the watchful eye of India Index Services and Products (ISL). The CNX in the name stands for CRISIL- NSE INDEX. CNX Nifty covers 22 sectors of the Indian economy and offers investors and investment managers’ exposure to the Indian market in one portfolio. It has shaped to be the largest single financial product in India.
The CNX nifty is calculated on a free float capitalization weighted index or Market value weighted index. The stock price of an individual company fluctuates on a daily basis and changes the index’s value. The impact that individual change in stock price has on the index is proportional to the company’s overall market value. The Nifty uses a rebalancing method to maintain stability in the index. The index is calculated on a real-time basis on all days that the NSE of India is open.
2.1 About the Paper
This academic project is about estimating the Weighted Average Cost of capital of the CNX Nifty 50, which is one of the stock indexes in India. Through this project, we are trying to come up with a typical benchmark for the WACC of stock index. This estimated new WACC can be treated as a reference against which organizations can evaluate their own cost of capital. In India, companies can raise a capital through debt, equity or mix of debt and equity for the expansion.
Therefore, it is very important for the company to know what will be the ideal cost of capital for raising the capital for the further expansion. Our calculated WACC of an index, Nifty 50 can be used as a benchmark or reference for any company to figure out the ideal mixture of debt and equity, which can make the company cost of capital closer to the WACC of the index.
The methodology computes the cost of capital for the index by including each of the fifty companies of the Nifty index. An aggregate cost of capital is then calculated for all the companies, leading to a new benchmark called the cost of capital of the Nifty 50 stocks.
2.2 Literature Overview:
There are already many research papers available in context of calculating WACC of individual companies and formation of Index but there are no published research papers available online, about the calculation of WACC of an Index. However, we found only one report through online search, which actually calculated the WACC of an index to a certain extent. We have referred the report but that report does not explain the calculation of WACC in details; secondly, the methods for the calculation of attributes are different from what we have used in our calculation. Lastly, we tried to analyze the pattern of WACC of an index (Nifty 50) with the incidents that happened across the duration of the study. It will help us to forecast the WACC of an Index.
3. Data Extraction and Methodology:
For our academic project, we have used fifty companies forming the Index Nifty 50 along with their relevant financial information, which is needed for the estimations of WACC. In order to understand the trend of WACC of a stock index, we have calculated WACC for last 9 years starting from 2005 to 2013.
The steps described below are carried out for each of the 50 companies separately that constitute CNX NIFTY 50 Index. The balance sheet of each the company was used for to extract necessary information such as short term and long term debts and equity positioning. Balance sheets are available in the annual report of all the companies. The Weighted Average Cost of Capital (WACC) was calculated using the following steps:
3.1. Estimation of Market Return:
The return on market portfolio (which is Nifty 50) is termed as market return. This market return is the primary factor while analyzing investments as this is the rate of return that market gives to the investor, provided investors invest in the Index. We have measured the last day of the year closing value of Nifty 50, compared that with the last day of the next year closing value of Nifty 50, and calculated market return using the below mentioned formula:
• Market Return = (Closing rate (t) – Closing rate (t-1))/ Closing rate (t-1)
http://www.investopedia.com/walkthrough/corporate-finance/4/capital-markets/average-returns.aspx
3.2. Estimation of Risk Free Rate:
The main expectation from an investor is to have a return on investment (ROI) i.e., to earn some amount on the investment in any financial asset. It is true to say that high-calculated risk will result in mostly higher yield. Hence, risk-bearing ability of any investor is one of the key parameters in deciding the ROI of any investors. Normally, Return on Government bonds particularly, 365-day T-bill is used as a tool or a benchmark for the risk free rate prevailing in the market. For our academic project, we have considered the one-year term deposit rate on Union Bank of India (UBI) as the risk free rate.
3.3. Estimation of Beta value :
Beta can be defined as a term used to measure volatility or systematic risk of a security when compared to market as a whole. Systematic risk cannot be eliminated. Investor expects higher return than risk free rate for bearing higher risk by investing in a stock and taking market risk. This value captures the correlation between the factors that affect the market portfolio. We have taken daily beta from starting day of the year to last day of the year from Bloomberg and taken the average. This gives us the beta of one particular company. This process is repeated for 50 companies and for 9 years starting from 2005 to 2013.
http://www.investopedia.com/terms/b/beta.asp
3.4. Estimation of Short Term Debt :
This is a part of current liabilities portion in a company’s balance sheet. It is composed of debt incurred to the company, which is due in one year. It is usually made up of short-term bank loans taken by company. We have extracted the short-term debt information from respective balance sheets of each company.
3.5. Estimation of Long Term Debt :
A company is financing or leasing obligations that due in a greater than 12-month period are long-term debts. These generally include bond issues or long-term leases.
We have extracted this information from balance sheet for all the companies for all the 9 years.
3.6. Estimation of Total Debt:
Total Debt is the sum of Short Term debts and Long-term debts of the company. Once we are able to get short term and long-term debt using above methodology, we can easily add them together and get the total debt of a company. Similarly, for rest of the companies and for the rest of the years, the same can be calculated.
http://www.investopedia.com/terms/s/shorttermdebt.asp
http://www.investopedia.com/terms/l/longtermdebt.asp
3.7. Estimation of Equity Portion of Companies :
The total equity portion of a company is important in order to calculate Market Capitalization of a company. We have extracted this information from balance sheets of all the 50 companies for the 9-year duration.
3.8. Market Capitalization :
Market Capitalization is the sum of Total Debt and Total Equity. Once we are able to get total debt and equity using the above methodology, we can easily add them together and get the Market Capitalization of a company. Similarly, the market capitalization for the rest of the companies for the nine years can be calculated.
3.9. Estimation of Weight of Equity and Debt:
We have calculated the weight of equity and debt components, which is required for calculating WACC, by using the formulae noted below:
• Weight of Equity = Total Equity/Market Capitalization
• Weight of Debt = Total Debt/Market Capitalization
We have already calculated Total Equity, Debt and Market Capitalization using above methodology, therefore, by substituting the respective values in the above formula we can get weight of debt and equity of respective companies for all the 9 years.
http://www.investopedia.com/terms/s/stockholdersequity.asp
http://www.investopedia.com/terms/m/marketcapitalization.asp
3.10. Estimation of Cost of Equity
Cost of equity is the rate of return companies’ shareholders expect from them. It is calculated using a Capital Asset Pricing Model (CAPM) model. According to this model, investor expects return, which is the sum of the risk free rate and the product of beta of respective companies and the market risk premium (Market return- risk free rate). Formula to calculate cost of equity using CAPM model is given below:
Since we have already estimated risk free rate, beta and Market return using the above methodology, by substituting the respective values in the above formula we can estimate the cost of equity of the respective companies for all the 9 years.
http://www.financeformulas.net/Capital-Asset-Pricing-Model.html
3.11. Estimation of Cost of Debt
Cost of Debt is the rate of return that a company is obliged to give to its bondholders. In order to calculate the cost of debt, firstly, we have taken the interest expense for all the years from the Profit and Loss statement (available in annual report) of their respective companies. Then we have divided the interest expense of a company with their total debt, which we have estimated in above methodology. This will give us the cost of debt of a company. Same procedure is repeated for all the companies for all the 9 years.
3.12. Estimation of WACC of Individual Companies
WACC is the overall cost of capital in order to raise capital from the company’s perspective, which they have to provide to their bondholders and shareholders. Thus, it is a combination of cost of equity and debt holders. Debt components provide a tax shield, which helps in reducing the overall cost of capital.
Here in order to estimate the WACC, we have used the below mentioned formula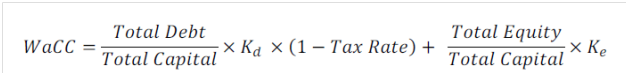
We have already estimated (Total Debt/ Total Capital beta) which is termed as weight of debt, (Total Equity/ Total Capital beta) which is termed as weight of equity, cost of equity and cost of debt using above methodology. Therefore, by substituting the respective values in the above formula we can estimate the cost of equity of respective companies for all the 9 years.
http://www.investopedia.com/terms/c/costofdebt.asp
http://accountingexplained.com/misc/corporate-finance/wacc
3.13. Estimation of WACC of an Index
WACC of an index is estimated by assigning weight to each of the individual companies. WACC based on the market capitalization over index market capitalization. The Formula, which we have used to calculate the WACC of an index, is mentioned below: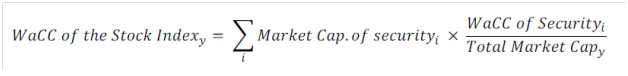
We have already estimated Market Capitalization of all 50 securities, their individual WACC and total Market Cap of an index using above methodology. Therefore, by substituting the respective values in the above formula we can estimate the WACC of an Index for all the 9 years.
3.14. Estimation of Cost of Equity (CoE) of an Index
CoE of an index is estimated by assigning weight to each of the individual companies cost of equity based on their market capitalization over index market capitalization. The Formula, which we have used to calculate the CoE of an index, is mentioned below: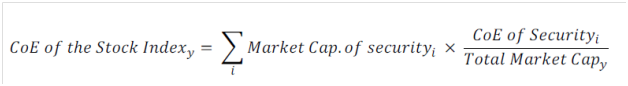
We have already estimated Market Capitalization of all 50 securities, their individual cost of equity and total Market Cap of an index using the above methodology. Therefore, by substituting the respective values in the above formula we can estimate the CoE of an Index for all the 9 years.
3.15. Estimation of Cost of Debt (CoD) of an Index
CoD of an index is estimated by assigning weight to each of the individual companies cost of debt based on their market capitalization over index market capitalization. The Formula, which we have used to calculate the CoD of an index, is mentioned below: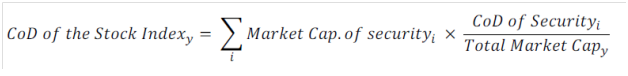
We have already estimated Market Capitalization of all 50 securities, their individual cost of debt and total Market Cap of an index using the above methodology. Therefore, by substituting the respective values in the above formula we can estimate the CoD of an Index for all the 9 years.
4. Result and Analysis
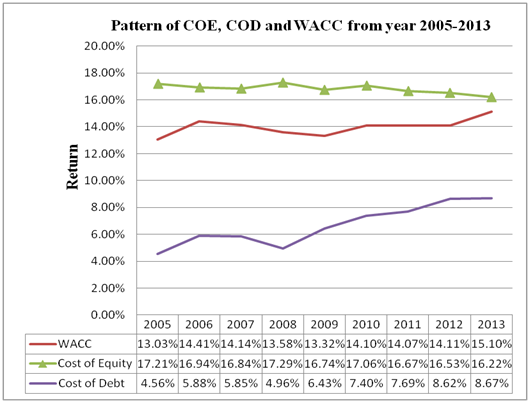
Fig1: Source: Spreadsheet used to calculate WACC of an Index.
Figure 1.shows the line chart of WACC, cost of equity (CoE) and cost of debt (CoD), of the index CNX Nifty 50 from year 2005 to 2013. The immediacy of the WACC (red line) to the CoE (green line) shows companies prefer equity financing over debt even if it is an expensive source of capital, and take good amount of time to raise the money. From the chart, it is visible that, CoE is higher up to 17.21% in year 2005 and dipped to 16.22% in 2013. This variation of CoE during last 10 years period was about 1%. However, CoD was 4.56% in 2005 and peaked to 8.67% in 2013. The variation of CoD during this period was about 4.1%. This enormous disparity shows the instability of interest rates in India over the last one decade. One of the reasons of this disparity is the continuous effort of Reserve Bank of India to control inflation by taking various steps under monetary policies.
From Fig 1.CoD gradually increased in 2008. One of the reasons for that is that the year 2008 is the year in which the subprime crises happened. Therefore, increase in cost of debt would be a step taken by regulatory body to protect the economy by making financing costlier and reducing inflation. It also indicates a better risk management method to control the inflation.
In Figure 1, year 2007-2008, the CoE went up by 0.45% and CoD went down by 0.89% during this period. This shows debt financing was available at cheaper rate during this period. Moreover, the movement of WACC (red line) followed the CoD line (purple line), increasing the changes in the WACC as well as the preference of the companies towards debt financing during this particular period.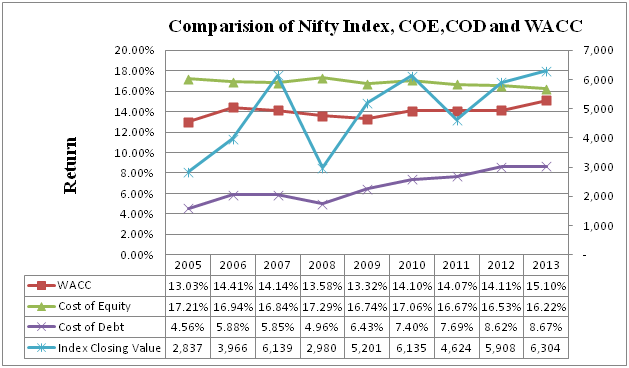
Fig2: : Spreadsheet used to calculate WACC of an Index.
In fig.2, none of the three chart lines could be measured as a perfect indicator of the performance of the Nifty closing price. The Nifty price increased significantly from 2005 to 2007. Subsequently, it saw a fall until 2009 before rising again. To a certain extent, the CoD line could be used in forecasting the Nifty graph.
5. Conclusion
Through this academic project, we tried understanding the behavioral uniqueness of WACC, cost of equity (CoE), and cost of debt (CoD) of an index over the last 9 years (2005–2013). We also examined how WACC, CoE and CoD behaved during the recessionary phase. In addition to that, we realized that WACC, CoE and CoD alone cannot predict the overall economy of a country. Since the WACC of a company depends upon multiple factors, it is not possible get the ideal WACC from a broader medium like Nifty 50 or any other index.
Additional study is necessary to come up with a suitable WACC, which can be the preferred benchmark capital structure for individual companies.
The objective of calculating the WACC of the Index was not to give an ideal WACC to an individual company. It was just to provide a reference point for a company.
The above assignment is to help student, researchers know the basic structure of a paper to help them in their assignment or dissertation related to accounting and finance. If you require academic help in your dissertation or research paper then get in touch via mail at info@thoughtfulminds.org. As a leading academic writing services provider in India, we can help you get rid of your assignment fear.